An auditor opens your extraction output for a balance sheet. The model reports 99.2% cell accuracy. Impressive. Then she totals the asset column by hand, the way auditors do, and it comes to a number that is off by one row. Assets no longer equal liabilities plus equity. The statement does not close.
The 0.8% the model got wrong was not a typo in a footnote. It was the total.
This is the quiet scandal of table extraction in finance. We know it firsthand, because we built our early pipelines to chase exactly these scores: benchmarks that grade a table as a grid of strings, while the only question a financial reader actually cares about goes unasked. Do the numbers still hold? The metrics that win leaderboards are, mathematically, blind to the errors that end careers.
What the benchmarks actually measure
If you have shopped for a table-extraction model, you have seen the scores. TEDS. Cell-match accuracy. Grid similarity. They all reduce to the same idea: line up the predicted table against the ground-truth table, walk the cells, and count how many match.
TEDS (Tree-Edit-Distance Similarity) is the popular one. It turns each table into a tree of rows and cells and measures how many edits it takes to turn one tree into the other. Fewer edits, higher score. It is a genuinely clever metric, and it was built to answer a genuinely useful question: is this roughly the right table, with roughly the right shape and text?
That question is fine for a literature review or a Wikipedia scrape. It is the wrong question for a cash flow statement.
Because here is what every one of these metrics treats a number as: a string. The cell 1,234.56 is, to the scorer, six glyphs in a box. It has no idea that this box is supposed to be the sum of the four boxes above it. It has no idea that the value in the row labeled "Total assets" is load-bearing in a way the value in "Misc. accruals" is not. Every cell is worth the same fraction of the score, and the score is an average.
In finance, the errors are never evenly distributed. And the average hides exactly the place you need to look.
Four ways a 99% score still hands you wrong numbers
Here are the failure modes a string-similarity metric cannot see. Each of these scores beautifully and ruins your day.
1. The column that slipped
A multi-column financial table has "2023" and "2022" side by side. The extractor reads the geometry slightly wrong and shifts every value in the prior-year column one cell down. Now every 2022 figure is attributed to the wrong line item.
To a cell-match metric, almost nothing happened. The same strings are present, in nearly the same cells. TEDS barely flinches. To a reader, every single prior-year number is wrong, and the variance analysis built on top of it is fiction.
The source statement
The kind of statement an extractor is actually handed: a header cell merged across both year columns, a notes column, full-width section rows, indented sub-items and dotted leaders. Obvious to a human, a minefield for a parser deciding which number belongs to which row and year. Every figure here is correct.
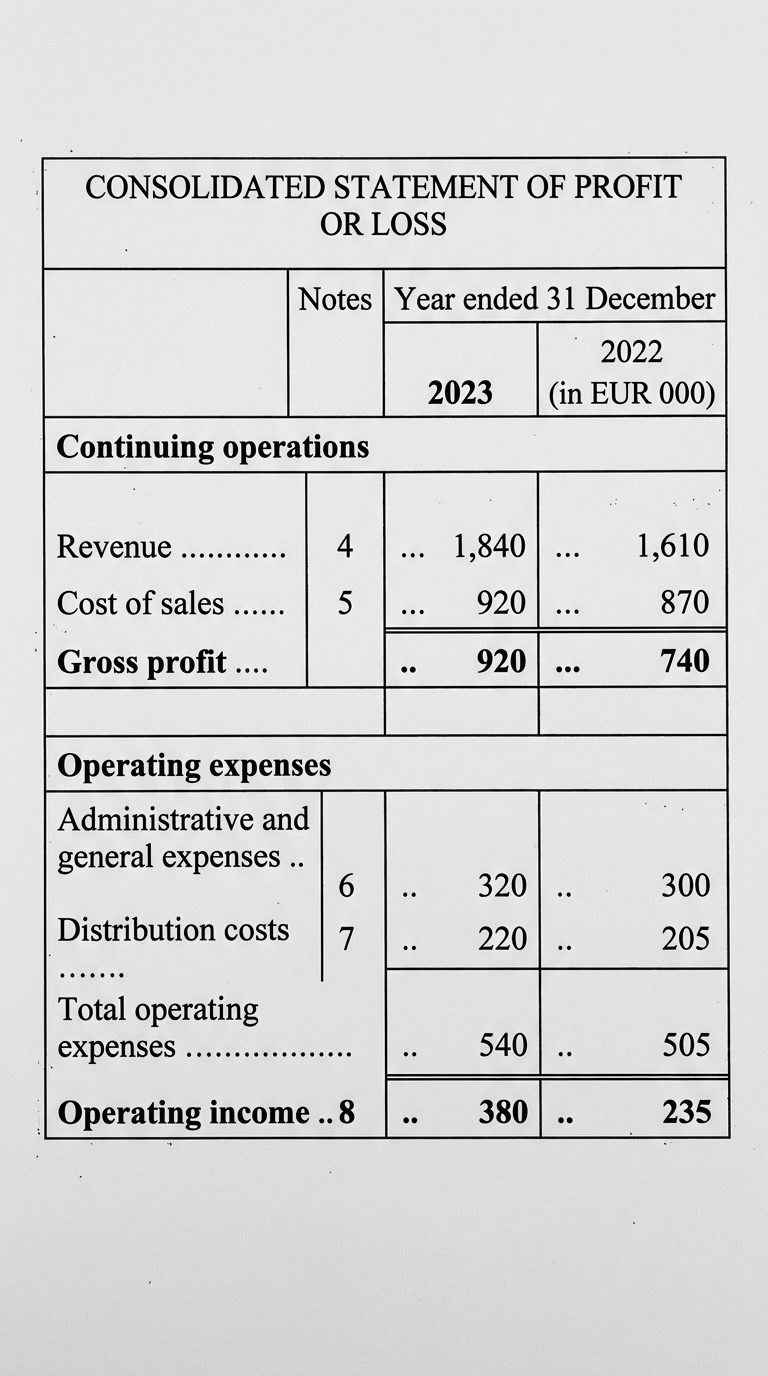
The column that slipped
The 2023 column extracted fine. Every value in the 2022 column landed one row too low, so each prior-year figure now sits on the wrong line. The label tells you whose number actually landed in that cell.
| Line item | 2022 — in the document | 2022 — as extracted |
|---|---|---|
| Revenue | 1,610 | —value dropped |
| Cost of sales | 870 | 1,610Revenue’s |
| Gross profit | 740 | 870Cost of sales’ |
| Opex | 505 | 740Gross profit’s |
| Operating income | 235 | 505Opex’s |
2. The decimal that moved
A German statement writes 1.234,56. The model, trained on a comma-as-thousands world, helpfully "corrects" it to 1,234.56, or worse, strips the separators and returns 123456.
The digits are all there. String similarity is delighted. The value is off by a factor of one hundred. Switch to a French statement, where the thousands separator is a space, and the same model splits one number into three.
Locale is not formatting. Locale is arithmetic. A comma in the wrong place is not a style choice, it is a different number.
3. The header that wandered off
The numbers extract perfectly. Every digit correct. But the column header "Restated" got merged into the one next to it, so now you cannot tell which figures are the restatement and which are the original. The cells match the ground truth. The meaning does not survive.
A table where the numbers are right and the headers are wrong is not 95% correct. It is a pile of correct digits with no idea what they count. In finance, a number without its label is not data. It is noise that happens to be numeric.
4. The negative that turned positive
Accountants write negatives as (1,200). Plenty of extractors read the parentheses as decoration and return 1,200. A provision becomes an asset. An outflow becomes an inflow.
One character. The sign of the cash flow. The metric counts the digits as a match and moves on.
Why the metric literally cannot see the problem
Notice the pattern. In every case above, the table is structurally fine and arithmetically broken. The rows are there, the columns are there, the strings are close. Structure passed. Arithmetic failed. And the score cannot tell the difference, because it was never measuring arithmetic in the first place.
The document the benchmark scores
A revenue note straight from a report: merged year header, a notes column, numbered lines. A model will read every digit perfectly and still hand you a total that does not add up.
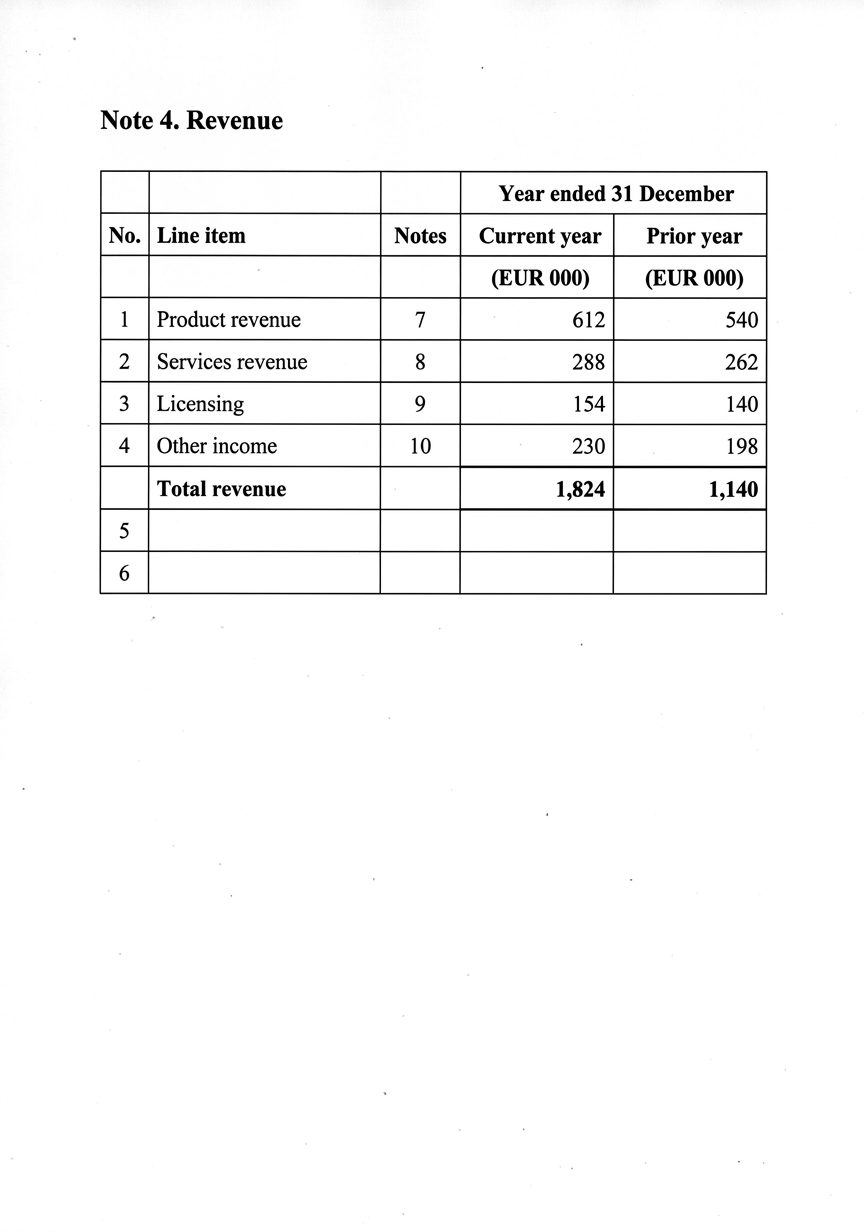
Structure passed. Arithmetic failed.
Every cell matches the reference, so each earns its green check. But add the four line items up and they come to 1,284 — not the 1,824 printed on the total line. A string metric has no way to see that gap.
| Line item | Amount (€000) |
|---|---|
| Product revenue | 612 |
| Services revenue | 288 |
| Licensing | 154 |
| Other income | 230 |
| Sum of the four lines | 1,284 |
| Total revenue (as printed) | 1,824Δ 540 |
This is not a tuning problem. You cannot fix it by weighting some cells more heavily, because the metric has no representation of the relationships that matter. It does not know that a column should sum to its total. It does not know that assets equal liabilities plus equity. It does not know that this quarter's closing balance is next quarter's opening balance. To a string-similarity score, a balance sheet and a takeout menu are the same kind of object: a grid of text.
The information that makes a financial table financial, the constraints between the numbers, is exactly the information these benchmarks throw away before scoring even begins.
So you get models that top the leaderboard and still cannot be trusted with a P&L. The leaderboard was never testing the thing you need.
The metric finance actually needs
Here is the reframe. Stop asking "how similar is this table to the reference table." Start asking "does this table close?"
A financial statement is not a fuzzy artifact you score with a percentage. It is a system of equations with known invariants:
- Line items sum to their subtotals. Subtotals sum to their totals.
- On a balance sheet, assets equal liabilities plus equity.
- In double-entry data, debits equal credits.
- A closing balance in one period equals the opening balance in the next, absent an explicit restatement.
- A percentage column, recomputed from its source columns, reproduces itself.
These are not heuristics. They are the definition of a correct statement. And they give you something a similarity score never can: a binary, document-internal check that needs no ground truth at all. The table either reconciles or it does not. When it does not, you do not need an annotator to tell you something is wrong. The arithmetic tells you.
In pseudocode, the test that actually matters looks nothing like an edit distance:
# Not: how close are these two grids of strings?
# But: does the extracted table obey its own arithmetic?

def reconciles(table):
    for total_row in table.totals():
        components = table.rows_feeding(total_row)
        if abs(sum(components) - total_row.value) > tolerance:
            return Fail(total_row, expected=sum(components), got=total_row.value)

    if table.is_balance_sheet():
        if abs(table.assets - (table.liabilities + table.equity)) > tolerance:
            return Fail("balance sheet does not balance")

    return Pass()
The beautiful part: this check runs on a single document, with no reference annotation, in production, on the real statement your customer just uploaded. A cell-similarity benchmark can only tell you how a model did on someone else's test set last month. Reconciliation tells you whether this number, the one about to flow into a credit decision, can be trusted right now.
Two questions, two metrics
The industry built table metrics to answer one question. Finance was always asking a different one.
What the benchmarks ask
“Is this roughly the right table?”
- A string of glyphs in a box
- Worth the same as every other cell
- Averaged into one number
- Sums and subtotals
- Sign and parenthesis-negatives
- Decimal and locale shifts
- Orphaned headers
What finance asks
“Does this table close?”
- Σ line items = subtotal = total
- Assets = liabilities + equity
- Debits = credits
- Closing balance = next opening*
- No ground-truth annotation
- Runs on one live document
A table that does not balance is not 99% right. It is 0% trustworthy. There is no partial credit on a statement that does not close.
How we think about this at Holofin
Turning chaotic financial documents into numbers you can stake a decision on is our actual job. The metric problem above is not academic to us. It is the difference between a model demo and a system an auditor will sign off on.
A few principles fall out of taking it seriously:
- Reconcile, don't resemble. We do not consider a table extracted until it obeys its own arithmetic. Totals must sum. Balance sheets must balance. Periods must roll forward. Resemblance to a reference is a development convenience. Reconciliation is the actual contract.
- A number is not a string. Every value carries its type, its sign, its locale, and its currency, parsed deliberately, not inferred from how it happened to be punctuated.
(1.234,56)is a negative twelve-hundred, and we treat it that way from the first pass. - Constraints over vibes. When the arithmetic does not close, that is not a rounding nuisance to suppress. It is a signal. We surface it, try alternative extraction strategies, and escalate to review rather than ship a confident wrong answer.
- Provenance per number. Every extracted value carries its page, its bounding box, and its header lineage, so a reviewer can click any number back to the exact pixels it came from. A figure you cannot trace is a figure you cannot defend.
This is also why we are careful about the numbers we publish. We see 97%+ zero-shot precision on common financial documents, and we build the tooling to catch the last few percent rather than pretend it does not exist, because in finance the last few percent is precisely where the total lives.
Closing
The industry built table-extraction metrics to answer "is this roughly the right table." Finance was always asking a different question: "do these numbers hold?"
A model can pass the first test and fail the second on the one row that matters, and the score will never tell you. So stop grading financial tables on how they look. Grade them on whether they balance.
If your extractor has ever passed a benchmark and still handed you a statement that did not close, you already know which number was wrong. It was the total. It is always the total.
Related Articles

Document Fraud Detection: What a PDF Can't Hide
We used to think document fraud was a visual problem. Wrong fonts. Misaligned columns. A logo that felt slightly off. We built checks around what humans see, because what humans see is all we had.

When Documents Fight Back
Page 1: Account summary, two columns. Page 15: Same account, three columns, different header names. Page 47: A scan with a coffee stain. Page 89: The totals page, which references transactions you extracted 70 pages ago.

The Invisible Audit Trail
An auditor opens your export file, finds a closing balance of €47,500, and pulls up the source PDF. Page 3, bottom-right corner: €47,000. Different number. "Where does the difference come from? Who changed it?"